


A Red-Hot Guide to the Steel Sector


Our aim through TVS Weekly is to break down financial stories and concepts simply, explaining what happened and why it matters to you.
No Jargon, no drama! Just stuff that actually makes sense.
Curious? Get more from us on our Instagram, WhatsApp, LinkedIn or YouTube. Our 1 Million+ family awaits you!
In this week’s newsletter, we will be learning:
The demand & supply characteristics of the steel industry.
Key risks faced by the steel industry.
Evolving Strategies used to manage risks & grow.
A Red-Hot Guide to the Steel Sector
Steel may seem like an old story, but it’s entering a new chapter.
Prices are down. Demand is slow. Chinese exports are rising. But downturns are when smart players prepare for their next leap.
India, the world’s second-largest producer, is set to scale from 120 to 300 million tonnes by 2030 as record-breaking furnaces, new mines, and cleaner tech drive the expansion.
Because when sectors like infrastructure, construction and manufacturing start rising again, the one material that powers them all is steel.
This week, we explore steel’s supply, demand, risks, and how companies still find ways to win.
Let’s dive in!
Demand for Steel
To understand demand for steel, we must understand:
Current Steel Consumption.
Equipment Flexibility.
Dual Sources of Cyclicality.
Powerful Buyers.
Current Steel Consumption
India produced 125.3 MT of crude steel and consumed 119.9 MT in FY23. But with per capita use at 95 kg vs the global average of 219 kg, the growth headroom is massive.
India’s steel demand is led by construction and infrastructure, which make up over 60% of total use. Other growing sectors include auto, railways, and engineering.
With strong growth across these areas, India is now the fastest-growing major steel consumer.

Equipment Flexibility
To understand equipment flexibility, we must look at India’s furnace stock. In FY25, blast furnaces made up 41%, induction furnaces 38%, and electric arc furnaces 21% of crude steel production.

Each furnace type impacts steel quality, cost, and raw material use. Blast furnaces make high-grade steel from iron ore but need heavy investment and cannot be started or stopped easily.
Induction furnaces use scrap, cost less, but often produce lower-grade steel. Electric arc furnaces also use scrap, can deliver high-quality steel, and offer flexibility to scale production up or down with demand.
Due to this lack of agility, production doesn’t match consumption.

Dual Sources of Cyclicality
Steel demand closely follows the economic cycle, rising in booms and falling in slowdowns, making the industry highly cyclical by nature.
The economic cycle isn’t the only one to blame, the CapEx cycle also adds to cyclicality.
In booms, steelmakers rush to expand. But plants take 3–5 years to build. By then, demand slows, new supply floods the market, prices fall, and traders cut orders.
Low utilisation of factories follows pushing weaker players into losses or even bankruptcy.
Powerful Buyers
Steel makers cannot set their own prices. Global rates and tough customers like auto and infra giants decide that. With no pricing power, profitability depends entirely on cost efficiency and scale.
Steel grades are standardised, so customers switch suppliers easily. They hold all the leverage, so customer continuity is low.

The only way to build continuity is through differentiated products, but standing out in a commoditised market is tough. Increasing profitability & competitiveness, therefore, isn’t from increasing prices, but efficiency in lowering costs.
Supply of Steel
To understand the supply of steel, we must understand:
Raw Material Accessibility Challenges.
Relationship of Supply to Profitability.
Producer’s Depth of Value Chain Involvement.
Providing & Increasing Supply.
Raw Material Accessibility Challenges
To understand steel’s raw materials, we need to understand how it’s made.

Steel is mainly made in two routes based on the source of energy, the coking coal route or the electricity route.
In either case, the major raw materials are sinter (processed iron ore) or steel scraps, oxygen and the source of energy. Both routes end in continuous casting.
The route chosen shapes the cost, quality, and sustainability of the steel. But, in either case, the metals themselves are 50-70% of the raw material cost.
Apart from cost, each raw material can be further understood based on its steadiness of supply & leverage.
Raw material supply in steel is dominated by a few large, often government-owned players. It’s an oligopoly. Whether it’s iron ore, coal, or power, steelmakers have no room to bargain. Suppliers call the shots.
Steadiness of supply is also a concern. To make just 1 tonne of steel, around 2.5 tonnes of iron ore and coal must be transported to the plant. But supplies & prices of coke and scrap aren’t steady.

Blast furnaces can't be shut down as cooling causes solidification and damage, making restarts costly and complex. So, any disruption throws operations off balance & costs go up & down.
Producer’s Depth of Value Chain Involvement
Not all manufacturers of steel are the same. They differ in their involvement in the value chain of producing steel, i.e in the steps from mining to making finished steel products.
The types of producers are:
Integrated: These are large players that handle everything in-house, from iron ore and coal to finished steel. They use blast furnaces, which run nonstop and need a steady raw material supply.
To manage this, they sign long-term contracts and set up plants near mines or ports to cut transport costs.
Primary: Primary producers make steel from raw ore. All integrated players are primary, but some primary producers outsource later steps like rolling or finishing.
Secondary: These use scrap instead of ore, buying it as needed. They avoid large inventories and run flexible operations, but face challenges with scrap price and supply swings.
Providing & Increasing Supply
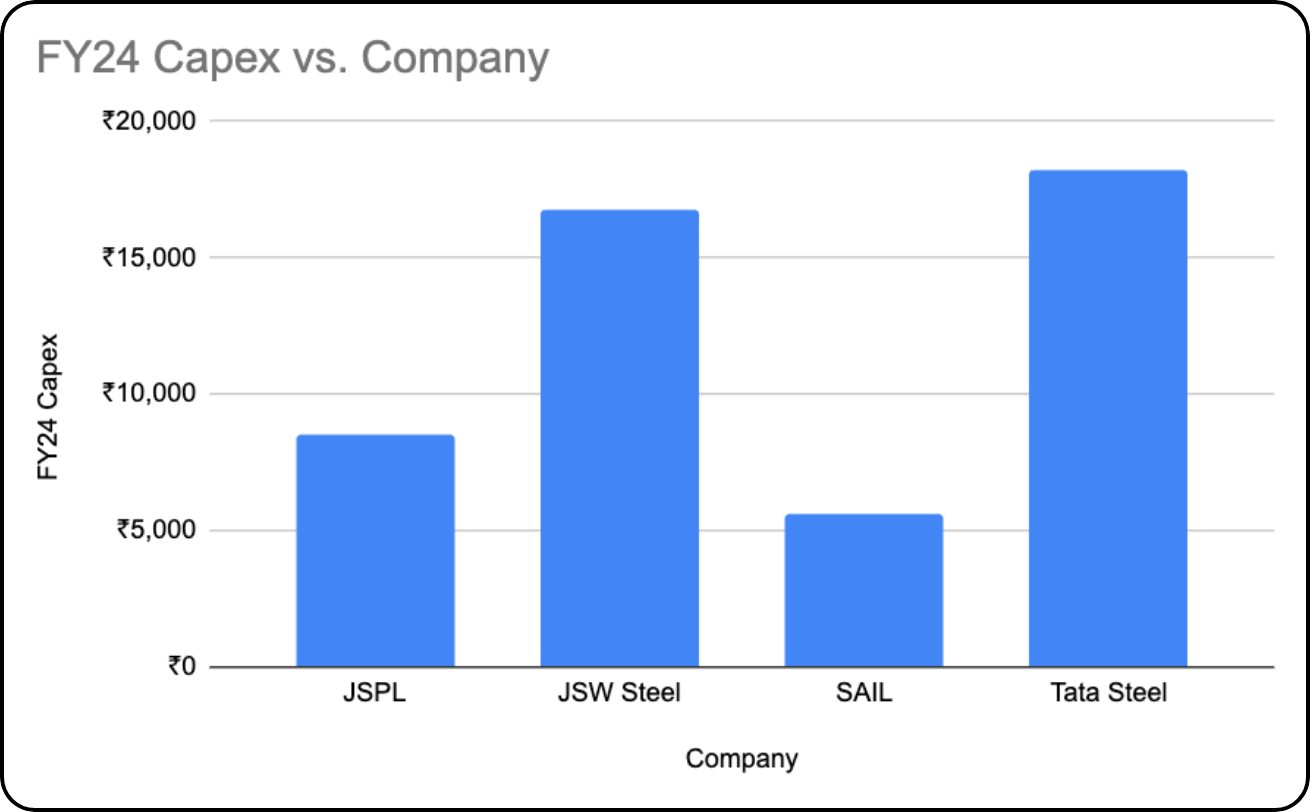
Steel is a high CapEx and OpEx business. For the top players, capex alone was around 10% of their revenues.
Steel plants run nonstop at over 1100°C. Companies hold large raw material and finished goods inventories. Combined with fuel, power, and transport costs, the long working capital cycle drives up working capital expenses.
For Capex, it comes in the form of new equipment & maintenance. Old machinery breaks down, energy use rises, and output slows. Firms need to invest in modern tech, expand capacity, and secure resources.
Delaying this hits efficiency, squeezes margins, and puts long-term growth at risk. Low efficiency, low profits.
Risks in the Steel Industry
To understand the risks in the steel industry, we must understand:
Negative Production Effects.
Global Risks.
Government Policy Dependence.
Negative Production Effects
Production is heavily dependent on coking coal, but that leads to a lot of pollution. For example, Tata Steel produces 2.2 tons of CO₂ per ton of steel. This trend isn’t really changing, as although India is building the most steel plants in the world, 86% will run on coal.
Current production contributes 12% of India’s emissions & emits more per tonne than China.
This dependence brings rising costs, global pressure, and up to $187 billion in future stranded assets based on India’s 2070 net-zero emissions goal.
Apart from emissions, other activities like mining harm local areas and affect worker health. ‘Greener’ options like Electric arc furnaces use coal-based power, adding indirect emissions and raising compliance costs.
Global Risk
Steel prices are set by global benchmarks, with domestic rates closely tracking international prices after factoring in duties and taxes.
Global risks can be thought of as export dependency & price competition.
Export Dependency: Export exposes Indian steel to global tariffs & climate rules. In 2025 itself US tariffs war could cut shipments by 85%, flooding the local market and hitting prices.
For climate policy, EU carbon taxes may penalise India’s high-emission steel, making exports costlier and less competitive globally. Players that rely on exports would be in trouble.
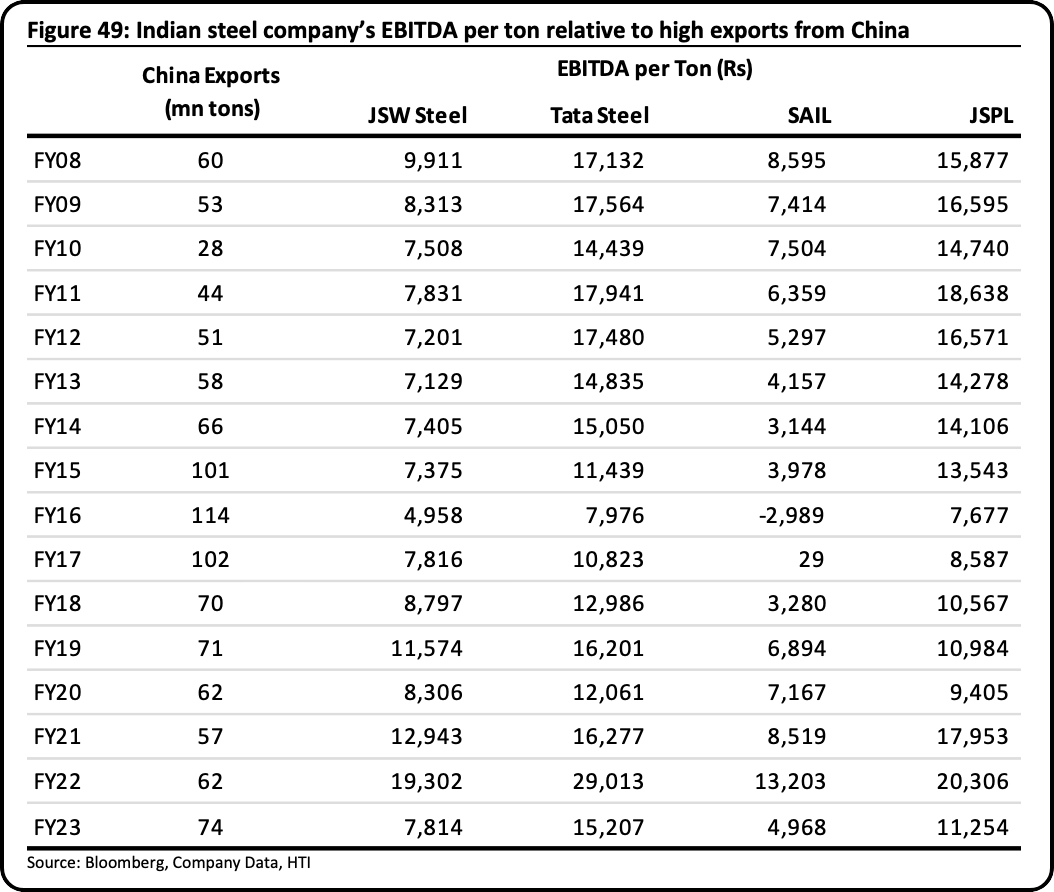
Price Competition: China is a mammoth player in the global steel market by dumping steel often at a loss to gain market share. Indian players are losing where, wherein the more China exports, the greater fall in EBITDA margins.
Government Policy Dependence
The steel industry is exposed to the risks of changes in regulations relating to land use acquisition, renewal or grant of mining rights and environmental clearances.
To expand mines & factories, companies need government approval. For this, India now auctions mining rights, but land, forest, and environmental clearances still take years.
Due to this, projects stall, costs rise, and smaller players struggle even though resources are abundant.
Secondly, to deal with global risks, steel relies on government support. This could be duties to block cheap imports and incentives to ease domestic oversupply through export incentives.
While this helps, such deep dependence creates policy uncertainty and long-term risk as revenue relies on policy being stable.
To truly understand these risks and how players navigate them, it is helpful to know a few key terms used in the industry.
Key Terms
Inventory Turnover (no. of days) - Shows how quickly a company sells its inventory, calculated as 365 divided by the inventory turnover ratio. Lower days mean faster stock movement and better working capital use. For JSW Steel in FY24, it was 78 days.
Value-Added Product (VAP) Mix (%) - Share of high-margin products (like coated steel or auto-grade steel) in total sales volume. A higher VAP mix boosts profitability. For example, JSW Steel had 61% of revenue from value-added products.
EBITDA per Tonne - Operating profit divided by tonnes of steel sold. Captures margin efficiency per unit. Helps compare across players. For instance, Tata Steel’s EBITDA per tonne improved to ₹8,335 in FY2025.
CO₂ Emission Intensity (tCO₂/tcs) - Tonnes of CO₂ emitted per tonne of crude steel (tcs) produced. Lower is greener. It reflects efficiency and regulatory risk. Tata Steel’s was 2.22 tCO₂/tcs.
Specific Energy Consumption (GJ/tcs or Gcal/tcs) - Energy consumed per tonne of crude steel. Lower GJ/tcs means better cost control and lower emissions. For example, JSPL’s was 27.09 GJ/tcs
Capacity Utilisation (%) - Actual production as a percentage of total installed capacity. High utilisation = fixed cost leverage. For instance, JSPL’s was 83% overall in FY24.
Raw Material Self-Sufficiency (%) - Share of key raw materials (iron ore, coal) sourced internally. Higher self-reliance cuts input cost volatility. JSW Steel’s target is to produce 50% of its iron ore requirement and up to 25% of its coking coal requirement captively
Revenue from By-products (₹ crore) - Income from slag, tar, gases, etc., usually waste streams. Adds margin cushion. In FY24, 4% of SAIL’s revenue was from byproducts.
Net Debt/ EBITDA - Total interest-bearing debt divided by annual EBITDA. A lower ratio means stronger financial stability. In FY24, SAIL’s was 3.03x.
How Steelmakers Turn Ore Into Opportunity
To understand winning strategies, we must understand:
Increasing Leverage by Consolidating.
Reducing Cyclicality with Diversification.
Taking Advantage of Integration.
Increasing Leverage by Consolidating
Profitability & competitiveness come through efficiency, and since both come through having large-scale operations, players focus on scaling. With the steel business being cyclical, so are its strategies to scale:
Upcycle: Strong steel companies reduce debt and build reserves during booms. This strengthens balance sheets and prepares them to take advantage of a stronger financial position during the downturn.
Downcycle: In downturns, financially sound players keep investing & acquire weaker firms as valuations are lower. They also continue projects while others stall due to weak cash flows or high leverage.
Through many cycles, the weaker firms go bankrupt or are acquired, leading to market consolidation. A smaller number of sellers means larger steel companies can negotiate better with their customers.
Reducing Cyclicality with Diversification
This diversification can happen from the sell side or buy side of production.
Sell Side: Steelmakers typically sell long products like rebars used in buildings and flat products like sheets used in cars. Flat products earn more but swing with demand. Longs offer price stability. Smart players make both.

To increase customer stickiness, players can also create high-grade custom steel for parts like engines or brakes. These need approvals, so once chosen, customers stick.
This mix of value-added and diversified helps firms earn steady margins, even when markets shift.
Further, even in the value-added segment, a healthy mix of customers & customers domestically & abroad can help diversify demand sources. If the auto sector is down, the construction sector can help demand.

Buy side: Key raw materials can often be unstable. Iron ore supply can stall due to permit delays, tariffs or local protests near mining zones. Coking coal from Australia faces weather disruptions and price shocks.
Having a diverse source of suppliers & raw materials here can give efficiency & hence a competitive advantage. They avoid bottlenecks, control costs, and keep production running while others slow down.
Taking Advantage of Integration
For larger players, integrating deeper in their value chain is a well-used strategy. Here, steel plants try to lower raw material costs by acquiring captive mines for iron ore and coal.
Some also produce their own coke and generate power using waste heat or renewables.
Locating plants near mines or ports cuts transport time and cost. This setup keeps input steady, reduces energy bills and improves margins, but at the cost of higher capex & more complex operations.
In conclusion, the steel industry depends on steady demand, reliable raw material reserves, global prices, and efficient operations. As construction and auto sectors grow, miners with large, approved reserves and lower costs are likely to gain the most.
And with that, we wrap up this month’s sector deep dive! I’d love to know your thoughts about our discussion, so feel free to comment below.
And don’t forget to like, share, and restack
Song of the Week:
This is Parth Verma,
Signing off.
From the title to the conclusion, this newsletter is professionally crafted. It delivers rich information, supported by relevant statistics, &clearly reinforces" information is king". Thank you for sharing & best wishes for many more to come.
Thank you, TVS team, for such an amazing, detailed industry outlook. Hope to see this type of research more in coming times.